

Rhys Taylor is creating some impressive astronomical work with Blender (check out my previous post on his work here). Today, he presents 'The Hydrogen Sky', a scientific visualization of the hydrogen distribution in our galaxy.
Rhys writes:
As an astronomer, the main part of my day job is to study the hydrogen gas content of other galaxies. Hydrogen is important because it's what stars form from. More importantly, the data is three-dimensional : we can measure where the hydrogen is on the sky (obviously) but also how fast it's moving toward or away from us.
Visualising the data in 3D can be a fairly... trying experience with standard astronomical tools, so I wrote scripts to import the data into Blender. And hey presto, I can use a sensible, user-friendly interface to examine the data. I can also interactively mask parts of the data and catalogue hydrogen detections about 50 times faster than with "normal" software.
But I also enjoy just looking at it, because it's damned pretty. 3D movies are great for public outreach. So in this video, I take a look at the hydrogen content of our own Milky Way galaxy. It starts using a galaxy simulation from my theoretical friend Rory Smith (he's a theoretician, not theoretically my friend) imported into Blender simply as x,y,z halo points. I added a particle system to increase the number of points, then froze them by baking the first 100 frames and starting the animation from that point on.
Then we take a look at the hydrogen itself, firstly using Arecibo, where I worked for two and a half years. I made the Arecibo model in the space of about a week, traipsing around the site in the summer heat of Puerto Rico, which was not particularly pleasant. The model is fairly simple by necessity, the real telescope is massively more complicated. It had to be done fairly quickly in time to use it for a video shown at Arecibo's 50th anniversary celebrations.
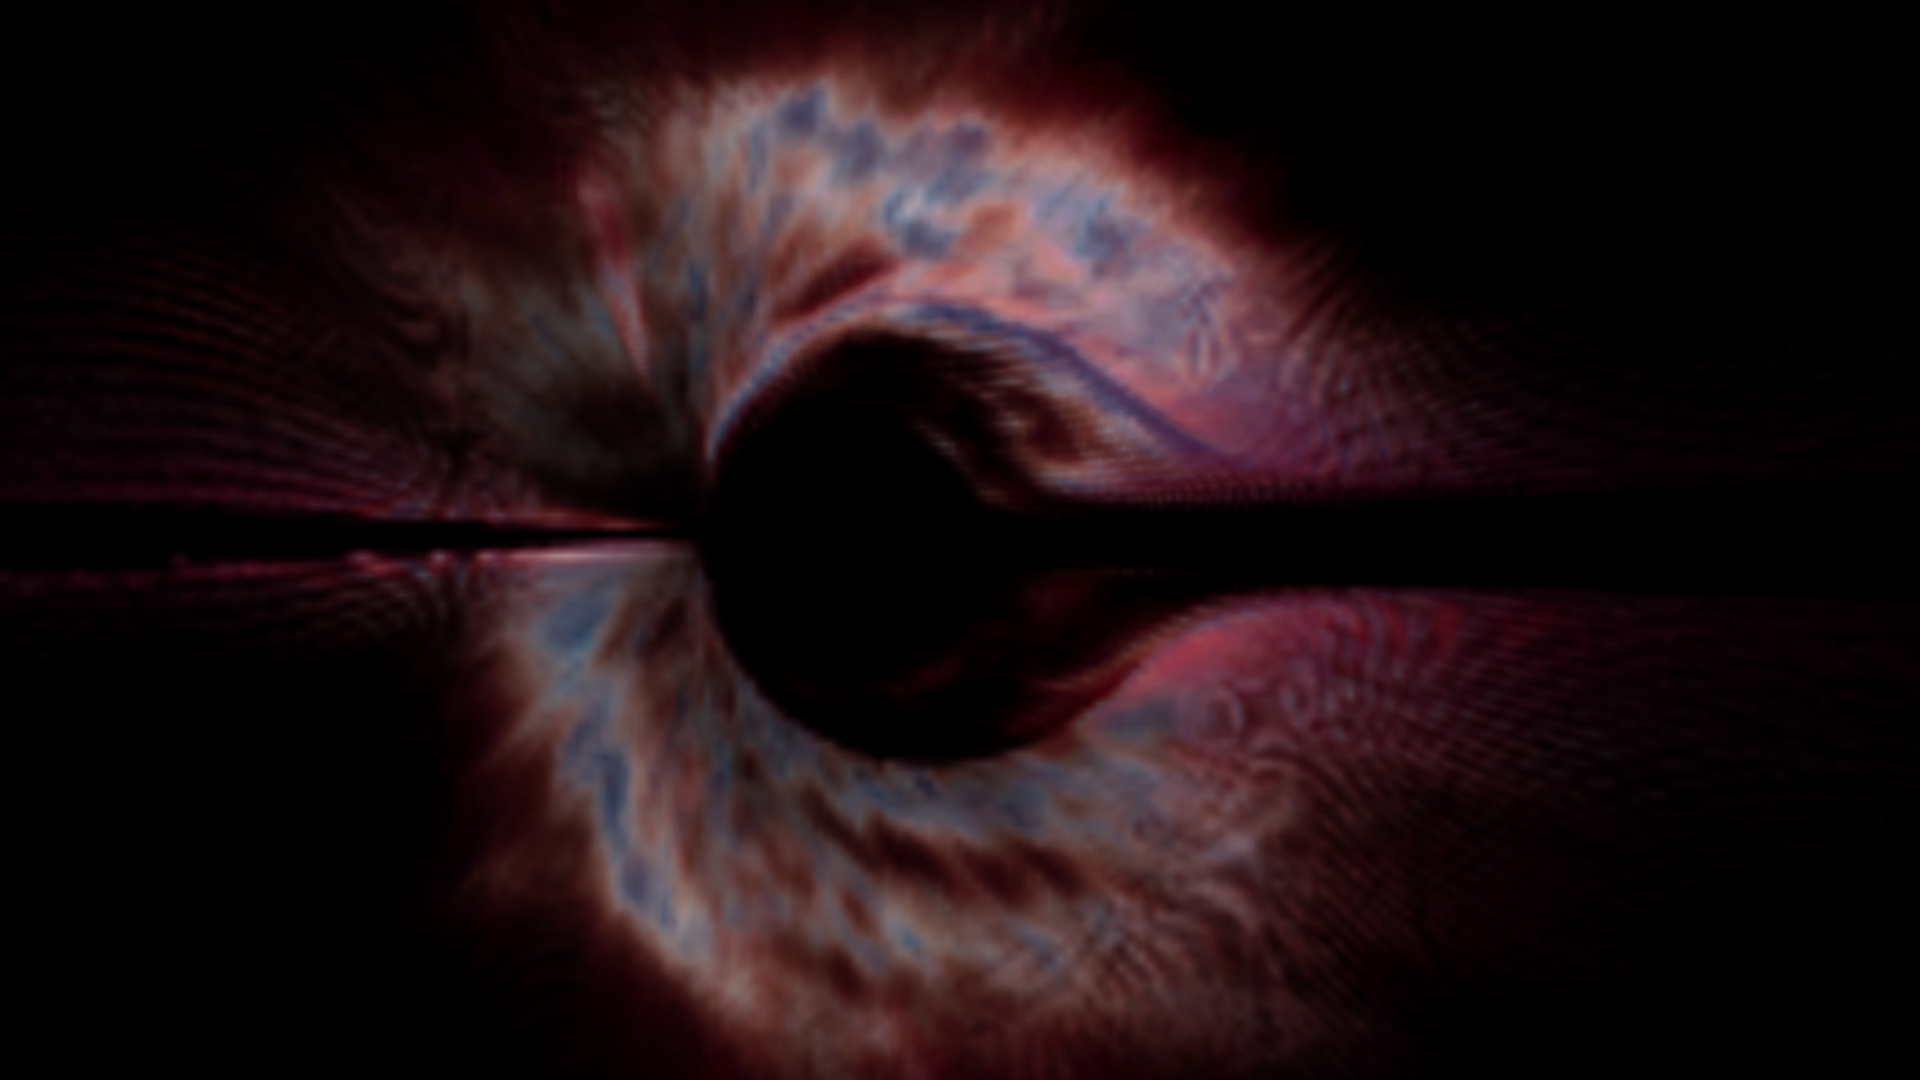
We then see the hydrogen content of the entire sky using data from the Leiden-Argentine-Bonn survey. Arecibo is fixed in the ground because it's 305m across, which limits how much of the sky it can see. Smaller telescopes are the only solution. The colours are generated based on the different velocities at which the gas is detected.
The video ends with a slightly more detailed look at what this "velocity space" really means. Treating velocity as being the same as distance, our galaxy would look like a VERY different place. There are some mathematical transformations we can apply to convert velocity into true distance, but they have some limitations. For parts of the galaxy closer to the center than the Sun, the equations break down. They also fail when the velocity is zero (this happens if we look directly towards or away from the galactic center - here the gas is moving across the sky, but not at all in the direction of our line of sight). Still, it's enough to show the arms of the outer part of the galaxy.
More details on the visualisation techniques can be found on my blog.


5 Comments
Awesome work!
Hi! The link (check out my previous post on his work here) from the text does not. It lands on an error page. Could you check it please?
Fixed, thanks! It's interesting that you're the first person to notice that ;-)
I hate this guy. His work is just too awesome!! :P
This is really awesome :)
Now that I think of it, I wonder how many scientists are also closeted artists.
A good resolution for 2014 would be to out more scientartistifics... (made up word, patent pending)