Bar Graph Highlighting and US Map Data Viz (Node Charts: October 2023 Update)
Blender Renaissance writes:
Hi,
The October update for “Node Charts: Info Graphs for Blender” has been released, here are the features.
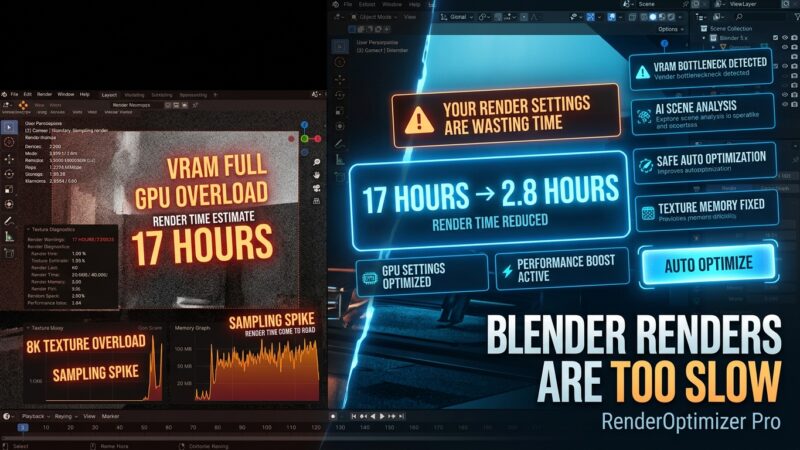
Here is the trailer for this update:
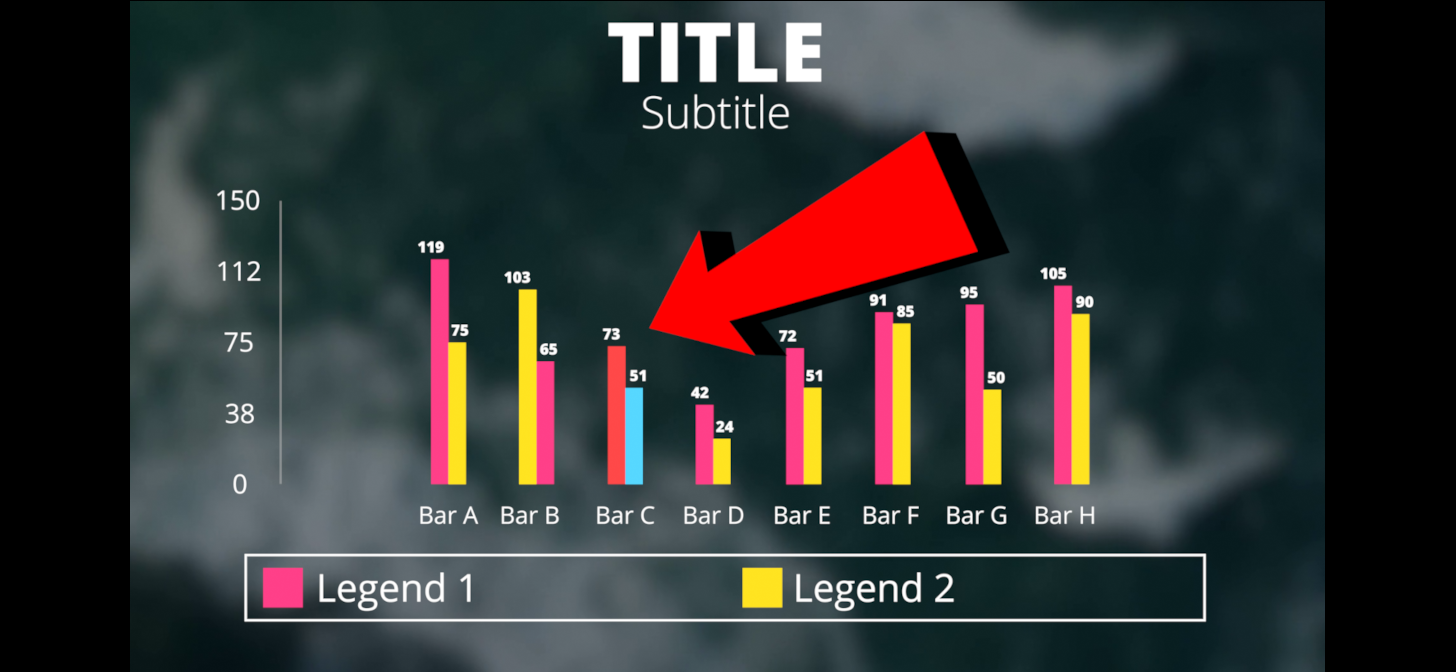
Bar Graph Highlighting:
You can now highlight specific bars to make them stand out in the scene. You can manually highlight any bar you want. You can highlight the highest value of all the bars and highlight the lowest value of all the bars.
US Map Data Visualization (Cycles Only):
Visualize Data from a CSV file or a MySQL Database. You can change the state names, Legend colors and have a column to add sources and credit.
Thanking you,
Vikrant Jadhav
Blender Renaissance